12 December 1982
| |||||||||||||||||||||||||||||||||||||||||||||||||||||
All 305 Portuguese municipalities and 4,260 Portuguese Parishes All 1,949 local government councils | |||||||||||||||||||||||||||||||||||||||||||||||||||||
|---|---|---|---|---|---|---|---|---|---|---|---|---|---|---|---|---|---|---|---|---|---|---|---|---|---|---|---|---|---|---|---|---|---|---|---|---|---|---|---|---|---|---|---|---|---|---|---|---|---|---|---|---|---|
| Turnout | 71.4% | ||||||||||||||||||||||||||||||||||||||||||||||||||||
| |||||||||||||||||||||||||||||||||||||||||||||||||||||
_(cropped).jpg)
.jpg)
.jpg)
Local elections were held in Portugal on 12 December 1982. They were the third local elections in Portugal since the 1976 Constitution introduced the concept of democratic local power.[7]
The elections consisted of three separate elections in the 305 Portuguese municipalities that existed at the time, the election for the Municipal Chambers, another election for the Municipal Assembly and a last one for the lower-level Parish Assembly, whose winner is elected parish president, this last was held separately in the more than 4,000 parishes around the country.
Once again, the Socialist Party finished on the top of the results table, increasing its share by 4 points, however, the total aggregate of the Democratic Alliance (AD), between the Democratic and Social Center, the Social Democratic Party and the People's Monarchist Party, stood at 42 percent of the votes and elected 165 mayors. The Alliance, however, lost some ground compared with the previous election, with the then PSD leader and Prime Minister Francisco Pinto Balsemão considering the results a disappointment, citing divisions with his own party and the alliance, and resigning from both posts.[8] This decision led to a snap general election in April 1983.
The left-wing United People Alliance dominated the election in the municipalities of the South of the country, gathering more than 60 percent of the votes and achieving its best result ever with 20.7 percent and 55 mayors. These would be the last elections in which local members would be elected for a 3-year term.
Background
Electoral system
All 305 municipalities are allocated a certain number of councilors to elect corresponding to the number of registered voters in a given municipality. Each party or coalition must present a list of candidates. The winner of the most voted list for the municipal council is automatically elected mayor, similar to first-past-the-post (FPTP). The lists are closed and the seats in each municipality are apportioned according to the D'Hondt method.[9]
By-elections (1979–1982)
During the normal three-year term of local governments, nine municipal council by-elections were held: In the municipality of Corvo on 18 May 1980; In the municipality of Vila do Porto on 20 July 1980; In the municipality of Aguiar da Beira on 27 July 1980; In the municipality of Mealhada on 23 November 1980; In the municipality of Murça on 31 May 1981; In the municipality of Nazaré on 14 June 1981; In the municipality of Valpaços on 13 September 1981; In the municipality of Loures on 11 October 1981; In the municipality of Praia da Vitória on 14 February 1982, adding to this, ninety-seven parishes also held a by-election for parish assemblies.[10]
| Date | Municipality | Population | Previous control | New control | ||
|---|---|---|---|---|---|---|
| 18 May 1980 | Corvo | 470 | Social Democratic Party (PSD) | Socialist Party (PS) | ||
| 20 July 1980 | Vila do Porto | 9,765 | Social Democratic Party (PSD) | Socialist Party (PS) | ||
| 27 July 1980 | Aguiar da Beira | 8,464 | Democratic Alliance (AD) | Democratic and Social Center (CDS) | ||
| 23 November 1980 | Mealhada | 16,669 | Democratic Alliance (AD) | Socialist Party (PS) | ||
| 31 May 1981 | Murça | 8,518 | Social Democratic Party (PSD) | Democratic and Social Center (CDS) | ||
| 14 June 1981 | Nazaré | 15,436 | Socialist Party (PS) | Socialist Party (PS) | ||
| 13 September 1981 | Valpaços | 26,066 | Democratic Alliance (AD) | Social Democratic Party (PSD) | ||
| 11 October 1981 | Loures | 276,467 | United People Alliance (APU) | United People Alliance (APU) | ||
| 14 February 1982 | Praia da Vitória | 20,762 | Social Democratic Party (PSD) | Social Democratic Party (PSD) | ||
Parties
The main political forces involved in the election were:
- Democratic Alliance (AD) (only in some municipalities)
- Democratic and Social Center (CDS) (only in some municipalities)
- Socialist Party (PS)
- Social Democratic Party (PSD) (only in some municipalities)
- United People Alliance (APU)
Results
Municipal Councils
National summary of votes and seats
| Parties | Votes | % | ±pp swing | Candidacies | Councillors | Mayors | ||||
|---|---|---|---|---|---|---|---|---|---|---|
| Total | ± | Total | ± | |||||||
| Socialist | 1,595,723 | 31.10 | 294 | 628 | 83 | |||||
| United People Alliance | 1,061,492 | 20.69 | 300 | 325 | 55 | |||||
| Democratic Alliance | 1,004,065 | 19.57 | 124 | 329 | 49 | |||||
| Social Democratic | 750,296 | 14.62 | 170 | 442 | 88 | |||||
| Democratic and Social Centre | 386,527 | 7.53 | 134 | 191 | 27 | |||||
| Socialist / UEDS | 37,102 | 0.72 | — | 5 | 14 | — | 1 | — | ||
| Popular Democratic Union | 31,973 | 0.62 | 72 | 3 | 0 | |||||
| Democratic Union | 30,941 | 0.60 | — | 2 | 6 | — | 0 | — | ||
| Portuguese Workers' Communist | 16,263 | 0.32 | 36 | 0 | 0 | |||||
| People's Monarchist | 11,293 | 0.22 | 10 | 5 | 1 | |||||
| Independent Social Democratic Action | 7,156 | 0.14 | — | 7 | 7 | — | 1 | — | ||
| Workers Party of Socialist Unity | 5,519 | 0.11 | 5 | 0 | 0 | |||||
| OCMLP | 1,450 | 0.03 | — | 6 | 0 | — | 0 | — | ||
| Christian Democratic | 849 | 0.02 | 1 | 0 | 0 | |||||
| Total valid | 4,940,649 | 96.28 | — | 1,949 | 305 | |||||
| Blank ballots | 90,037 | 1.75 | ||||||||
| Invalid ballots | 100,797 | 1.96 | ||||||||
| Total | 5,131,483 | 100.00 | ||||||||
| Registered voters/turnout | 7,185,284 | 71.42 | ||||||||
| Source:[13][11] | ||||||||||
Municipality map
.png)
Municipalities won by:
■ - PS: 84
■ - APU: 55
■ - AD: 49
■ - PSD: 88
■ - CDS: 27
■ - PPM: 1
■ - ASDI: 1
City control
The following table lists party control in all district capitals, highlighted in bold, as well as in municipalities above 100,000 inhabitants. Population estimates from the 1981 Census.[12]
Municipal Assemblies
National summary of votes and seats
| Parties | Votes | % | ±pp swing | Candidacies | Mandates | |||||
|---|---|---|---|---|---|---|---|---|---|---|
| Total | ± | |||||||||
| Socialist | 1,583,544 | 31.06 | 3,203 | |||||||
| United People Alliance | 1,076,742 | 20.98 | 1,781 | |||||||
| Democratic Alliance | 995,108 | 19.39 | 1,656 | |||||||
| Social Democratic | 725,203 | 14.13 | 2,159 | |||||||
| Democratic and Social Centre | 395,648 | 7.71 | 1,014 | |||||||
| Socialist / UEDS | 37,409 | 0.73 | — | 65 | — | |||||
| Popular Democratic Union | 34,788 | 0.68 | 20 | |||||||
| Democratic Union | 30,675 | 0.60 | — | 40 | — | |||||
| People's Monarchist | 10,553 | 0.21 | 28 | |||||||
| Portuguese Workers' Communist | 7,126 | 0.14 | 1 | |||||||
| Independent Social Democratic Action | 6,783 | 0.13 | — | 32 | — | |||||
| Workers Party of Socialist Unity | 2,463 | 0.05 | — | 0 | — | |||||
| Christian Democratic | 851 | 0.02 | 2 | |||||||
| OCMLP | 520 | 0.01 | — | 0 | — | |||||
| Total valid | 4,917,413 | 95.83 | — | 10,001 | ||||||
| Blank ballots | 112,966 | 2.20 | ||||||||
| Invalid ballots | 100,848 | 1.97 | ||||||||
| Total | 5,131,227 | 100.00 | ||||||||
| Registered voters/turnout | 7,185,284 | 71.41 | ||||||||
| Source:[13] | ||||||||||
Parish Assemblies
National summary of votes and seats
| Parties | Votes | % | ±pp swing | Candidacies | Mandates | Presidents | ||||
|---|---|---|---|---|---|---|---|---|---|---|
| Total | ± | Total | ± | |||||||
| Socialist | 1,551,888 | 30.43 | 12,848 | 1,025 | ||||||
| United People Alliance | 1,085,127 | 21.28 | 5,099 | 334 | ||||||
| Democratic Alliance | 925,065 | 18.14 | 7,863 | 754 | ||||||
| Social Democratic | 775,353 | 15.21 | 9,585 | 1,042 | ||||||
| Democratic and Social Centre | 400,306 | 7.85 | 4,944 | 413 | ||||||
| Independents | 60,209 | 1.18 | 999 | 113 | ||||||
| Socialist / UEDS | 30,820 | 0.60 | — | 281 | — | 18 | — | |||
| Democratic Union | 29,470 | 0.58 | — | 340 | — | 34 | — | |||
| Popular Democratic Union | 25,264 | 0.50 | 31 | 1 | ||||||
| People's Monarchist | 6,341 | 0.12 | 103 | 9 | ||||||
| Independent Social Democratic Action | 4,534 | 0.09 | — | 50 | — | 2 | — | |||
| Portuguese Workers' Communist | 4,390 | 0.09 | 0 | 0 | ||||||
| Workers Party of Socialist Unity | 809 | 0.02 | 0 | 0 | ||||||
| Christian Democratic | 503 | 0.01 | 0 | 0 | ||||||
| OCMLP | 452 | 0.01 | — | 0 | — | 0 | — | |||
| Total valid | 4,900,531 | 96.11 | — | 42,143 | 3,745 | |||||
| Blank ballots | 92,462 | 1.81 | ||||||||
| Invalid ballots | 106,117 | 2.08 | ||||||||
| Total | 5,099,110 | 100.00 | ||||||||
| Registered voters/turnout | 7,139,401 | 71,42 | ||||||||
| Source:[13] | ||||||||||
Maps
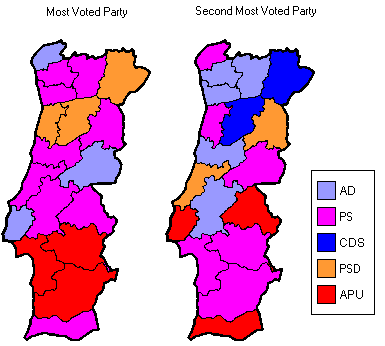 The first and the second most voted parties in Municipal Councils in each district. (Azores and Madeira are not shown)
- The first and the second most voted parties in Municipal Assemblies in each district. (Azores and Madeira are not shown)
 The first and the second most voted parties in Parish Assemblies in each district. (Azores and Madeira are not shown)


Notes
- The source of the voting data is the Portuguese Electoral Commission Archived 2014-10-25 at the Wayback Machine
Further Notes:
- Democratic Alliance (AD) was composed by the Democratic Social Center (CDS), the Social Democratic Party (PSD) and the People's Monarchist Party (PPM).
- Although the PSD, the CDS and the PPM were united in the Democratic Alliance, they appear in the scorecard because they ran separated in several municipalities.
- The Democratic Union (UD) was composed only by the Democratic Social Center (CDS) and the Social Democratic Party (PSD)
- United People Alliance (APU) was composed by the Portuguese Communist Party (PCP) and the Portuguese Democratic Movement (MDP/CDE).
- The number of candidacies expresses the number of municipalities or parishes in which the party or coalition presented lists.
- The number of mandates expresses the number of municipal deputies in the Municipal Assembly election and the number of parish deputies in the Parish Assembly election.
- The turnout varies because one may choose not to vote for all the organs.
See also
References
- Sum of PSD, CDS, PPM, AD and UD votes.
- Sum of PS and PS/UEDS votes.
- Sum of PSD, AD, CDS and PPM elected mayors.
- Sum of PS and PS/UEDS elected mayors.
- Sum of PSD, CDS, PPM, AD and UD elected councillors.
- Sum of PS and PS/UEDS elected councillors.
- "Decreto-Lei n.º 701-B/76, de 29 de setembro". Diário da República (in Portuguese). 29 September 1976. Retrieved 10 May 2026.
- "Demissão Pinto Balsemão", RTP-Antena1, 8 September 2015. Retrieved 14 December 2022.
- Eleição dos titulares dos órgãos das autarquias locais. Diário da República (in Portuguese.) Retrieved 17 July 2025.
- "Eleições / Referendos". Comissão Nacional de Eleições (in Portuguese). Retrieved 10 March 2026.
- "Eleições Autárquicas 2005 – Atlas Eleitoral" (PDF). Ministry of Home Affairs (in Portuguese). 2007. Retrieved 11 May 2026.
- "Instituto Nacional de Estatística (Recenseamentos Gerais da População)". www.ine.pt (in Portuguese). Statistics Portugal. Retrieved 17 July 2021.
- "Resultados Eleitorais SGMAI". Ministry of Home Affairs (in Portuguese). Retrieved 11 May 2026.
- "Presidentes das Câmaras Municipais Eleitos 1979" (PDF). www.cne.pt (in Portuguese). Comissão Nacional de Eleições. Retrieved 11 May 2026.
- "Presidentes das Câmaras Municipais Eleitos 1982" (PDF). www.cne.pt (in Portuguese). Comissão Nacional de Eleições. Retrieved 11 May 2026.